AI-Powered Dashboard Prototype
📋 5 Dashboard Tabs
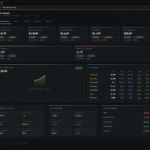
Executive Overview — The command center with all top KPIs at a glance, monthly trend chart, P&L summary table, and operations snapshot cards.
Revenue — Department breakdown with horizontal bar charts showing Actual vs Budget, revenue mix % by department, and trend chart.
Expenses — Cost category analysis, a full P&L waterfall (Revenue → Gross Profit → EBITDAR → EBITDA → Net Income), and margin KPI cards.
Operations — Golf rounds, revenue per round, membership count, and retention rate with full stats for both departments.
Cash Flow — EBITDA → Capex → Free Cash Flow → Ending Cash position with visual bars.
Categories
Finance / Accounts / GL
🎯 KPIs Covered
Every critical metric from the gap analysis is included — Net Income, EBITDAR, EBITDA, Gross Margin %, Payroll % of Revenue, Revenue by Department (6 segments), Revenue Mix %, Golf Rounds, Revenue per Round, Member Count, Retention Rate, Revenue per Member, Free Cash Flow, and Cash Position.
Each KPI card shows Actual vs Budget variance % + YoY growth % with color-coded indicators (green = favorable, red = unfavorable), and respects the inverted logic for expense ratios like Payroll %.
BI Dashboard Embed App
Technical Approach & Tools Used:
This is a prototype dashboard built using Claude MCP Server and Microsoft Power BI. The app is displayed via CodeSandbox and embedded on my portfolio using an iframe.
All calculations, visualizations, and UI design were generated with the help of AI tools through my prompts and guidance. This prototype demonstrates the efficiency of AI in automating data analysis and dashboard creation.
Claude designed the dashboard by first analyzing my semantic model to understand the data structure, relationships, and existing measures. It then identified missing measures and key business KPIs, created the necessary new measures, and finally generated the dashboard design with visuals and layout based on this analysis.
AI Tools (Claude + Prompts) – for calculations, UI design, and automation
Microsoft Power BI – for underlying analytics logic
CodeSandbox – to host and run the app online
HTML + iframe – to embed the app into the portfolio
VS Code + Live Server – for local development and preview
Lets Work Together
The technological revolution is changing aspect of our lives, and the fabric of society itself. it’s also changing the way we learn and what we learn

